Reduce Cycle Times in Manufacturing

What Is Cycle Time Loss?
Whenever equipment runs slower than its maximum operating speed (slower than its Ideal Cycle Time) it incurs cycle time loss. Cycle time loss is typically broken into two categories:
- Slow Cycles
- Small Stops
Slow cycles occur when equipment runs slower than its maximum operating speed – but is running. For example, an operator may deliberately run equipment slowly to manage material quality issues.
Small stops occur when equipment has stopped – but for a short enough period of time that the stop is more or less still considered to be part of a cycle (in other words it is not considered to be a down time event). An operator typically addresses small stops without the involvement of maintenance personnel. For example, an operator may clear repeated equipment jams caused by material feed issues.

How to Calculate Cycle Time Loss
When considering the production states of Run, Unplanned Stop, Planned Stop, and Not Scheduled, cycle time loss falls squarely in the Run state (it measures losses that occur while the process is running). However, it does not measure all losses that occur while the process is running. Quality losses are a completely independent category of loss.
A precondition for measuring cycle time loss is to know the Ideal Cycle Time of the process. Ideal Cycle Time is the theoretical minimum time to produce one piece (which may be different for different parts). Ideal Cycle Time is basically the same as maximum operating speed. Mathematically, the two are reciprocals of each other: Ideal Cycle Time is measured as time per part (e.g., one second per part) while maximum operating speed is measured as parts per time (e.g., one part per second; more commonly referred to as 3,600 parts per hour).
There are two common approaches to determining the Ideal Cycle Time:
- Nameplate Capacity: This is the maximum operating speed that the equipment builder specifies (e.g., you may buy a press with a design capacity of 120 strokes per minute).
- Time Study: This is the fastest measured speed that the process can achieve. It is not an average, standard, or normal speed. It is the maximum operating speed (minimum cycle time).
There are fundamental differences in how manual and automated systems capture cycle time loss, although both rely on an accurate Ideal Cycle Time.
Manual measurements of cycle time loss use a “mass balance” calculation with information typically captured at a granularity of shift or part:
Cycle Time Loss = Run Time – (Total Parts x Ideal Cycle Time)
Basically what this calculation says is: looking only at Run Time, compare how fast you could have manufactured the parts under ideal circumstances (Total Parts multiplied by Ideal Cycle Time) to how fast you actually manufactured the parts (Run Time). The difference between the two is cycle time loss. A problem with this type of calculation is it is very dependent on down time and changeover time being accurately captured (otherwise Run Time will not be accurate). Experience has shown that most manual data capture systems significantly underreport down time (which will artificially inflate cycle time losses).
Automated measurements of cycle time loss provide far more detailed and accurate information, including differentiating between slow cycles and small stops (two of the Six Big Losses). Automated systems compare each manufacturing cycle to the Ideal Cycle Time and calculate the cycle time loss for each and every part produced:
Cycle Time Loss = Run Time – (Total Parts x Ideal Cycle Time)
In order to measure cycle time loss accurately it is important to automate data capture and to follow a clearly defined measurement standard that is consistently applied over time and across equipment. We recommend the following definition:
Cycle time loss is measured as the difference between the Actual Cycle Time and Ideal Cycle Time for each piece that is manufactured (where the Ideal Cycle Time is the theoretical minimum time to produce one part).
Effects of Cycle Time Loss on Manufacturing Productivity
Cycle time losses are often hidden from view. They are frequently not tracked accurately (if at all) or acted upon effectively (if at all). There are a few reasons for this:
- Equipment that is stopped gets greater focus than equipment that is running. As a result, down time and changeovers typically get a much higher level of attention than equipment that is running slower than its maximum operating speed.
- Cycle time loss is often built into standard production times, which can cause operators to run equipment slower than its optimal operating speed (“we've always run this way”).
- Manual performance tracking (e.g., calculating OEE manually) relies on mass balance calculations that provide very little in the way of actionable details.
When equipment is configured to run slower than the Ideal Cycle Time, it is often a symptom of underlying equipment or material issues. For example, the operator may know that running slowly results in fewer jams or fewer rejected parts. Often, insufficient asset care and material quality issues are masked by running slower.
From the perspective of Overall Equipment Effectiveness (OEE) and Total Equipment Effectiveness (TEEP), cycle time loss is captured as a Performance Loss. From the perspective of the Six Big Losses, cycle time loss is captured as Reduced Speed (Slow Cycles) and Small Stops.
How to Reduce Cycle Time in 3 Steps
The following is a three-step process for reducing cycle times:
- Validate Your Cycle Time Standards
- Understand Your Cycle Time Losses
- Attack Cycle Time Loss On the Factory Floor
1. Validate Your Cycle Time Standards
Problem: We recognize that accurate Ideal Cycle Times are critical to accurately measuring cycle time loss, but we don't have nameplate capacity information and we are not sure how to validate our Ideal Cycle Times.
Strategy: Use plant-floor manufacturing data to perform simple time studies of actual cycle times for each part that you run.
Solution: There are two ways to use XL to validate your Ideal Cycle Times. The first is “quick and dirty” (exposing obvious problems) and the second is “slow and refined” (providing better accuracy).
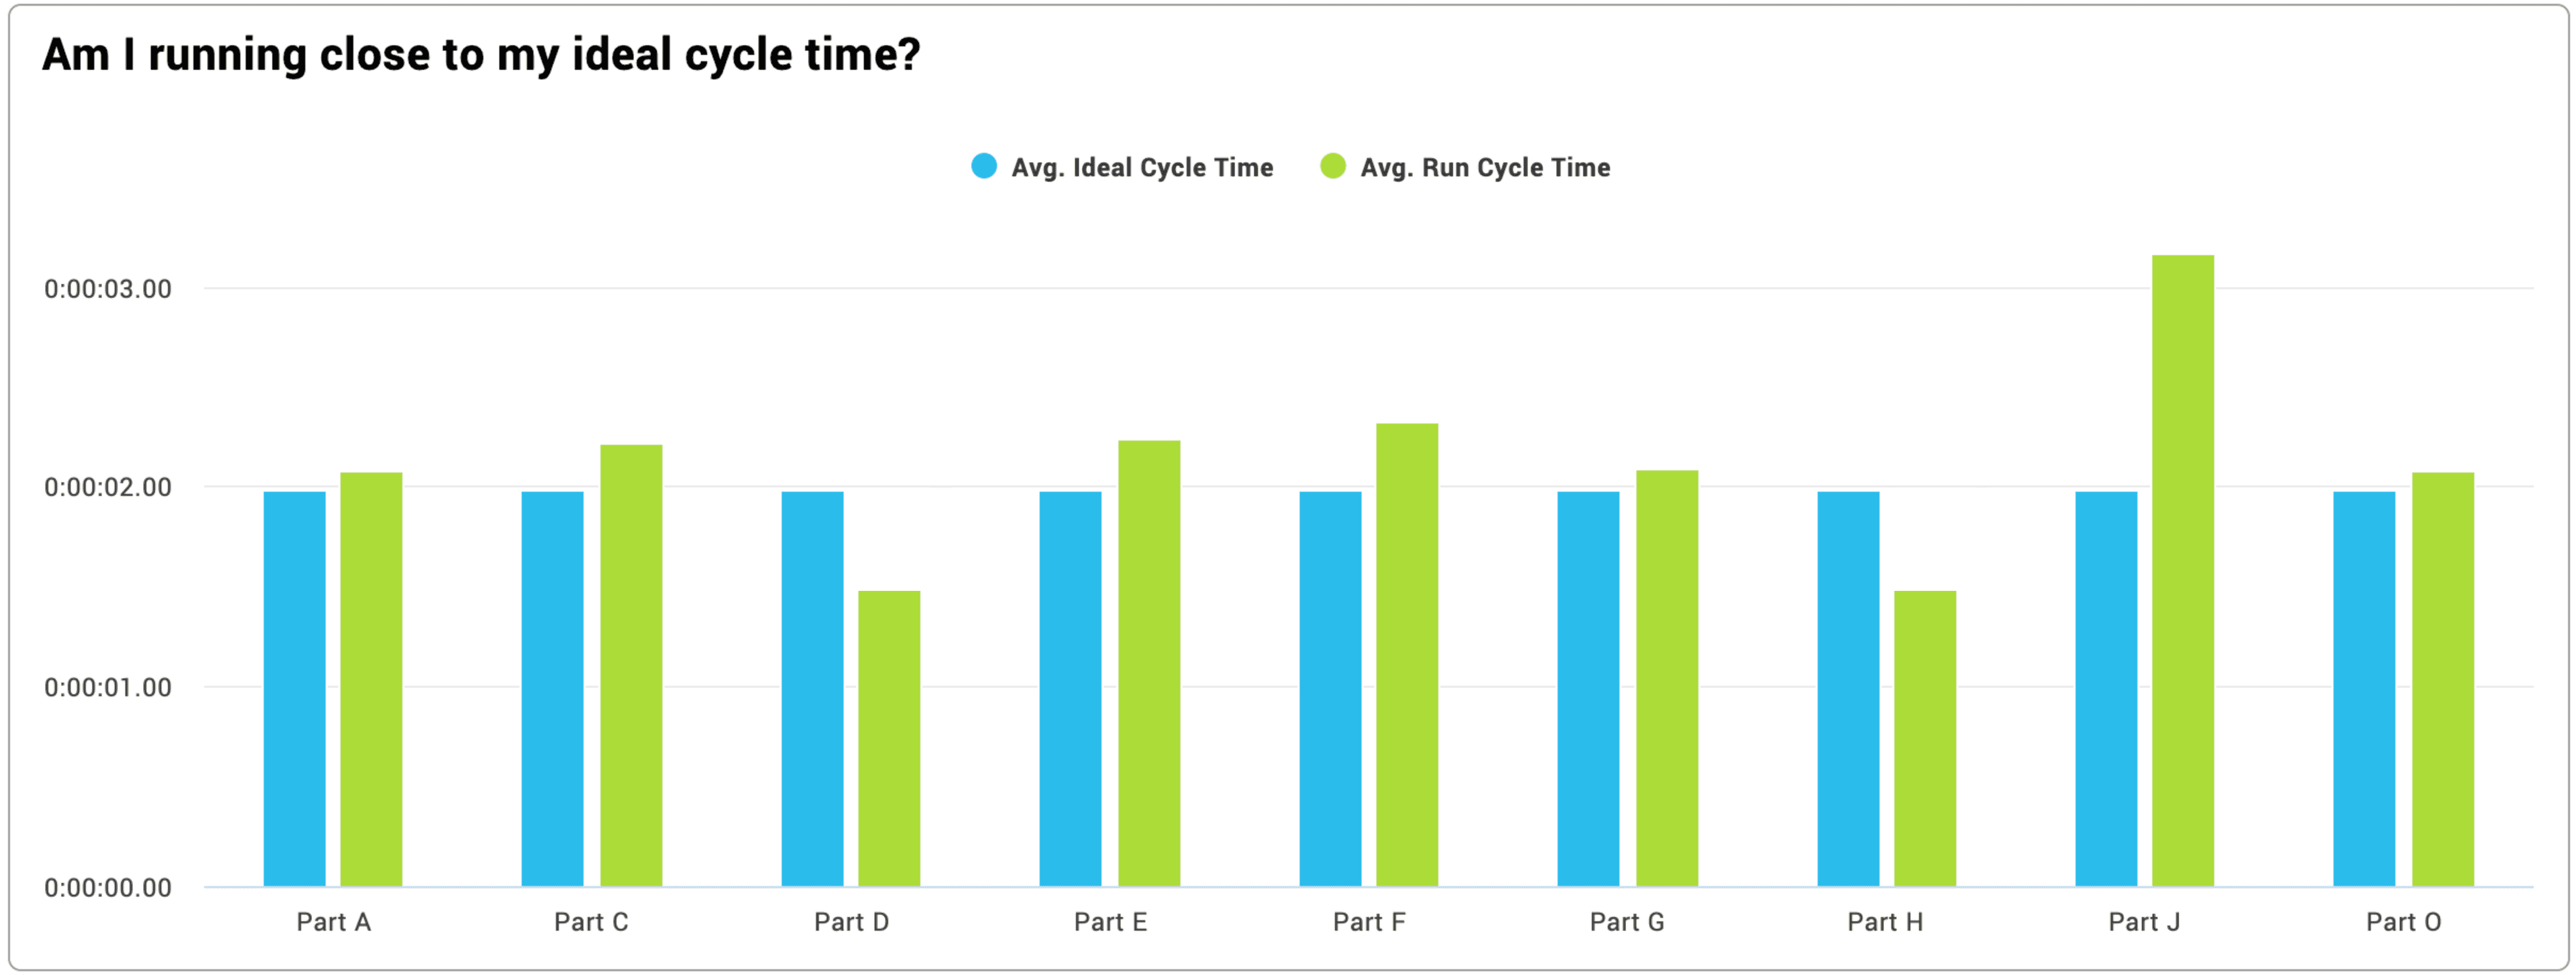
- XL records the Ideal Cycle Time and Average Cycle Time for every part that is run. Use Performance Loss to compare the two for each part. If the Ideal Cycle Time is higher than the Average Cycle Time it is set too high (lower the Ideal Cycle Time slightly below the Average Cycle Time). This is a surprisingly common problem.
- XL monitors every manufacturing cycle in real-time. Use Real-Time KPIs to perform a “best of the best” analysis of your actual cycle times. Each time you run a part (and the equipment is running well), monitor the Last Cycle Time metric for a period of time. Write down your best cycle times and use them as a basis for setting the Ideal Cycle Time.

2. Understand Your Cycle Time Losses
Problem: We want to start an initiative to reduce our cycle times, but before we do so we want to verify that we are losing significant productivity to cycle time loss.
Strategy: Check if cycle time loss is one of your top five sources of lost manufacturing productivity.
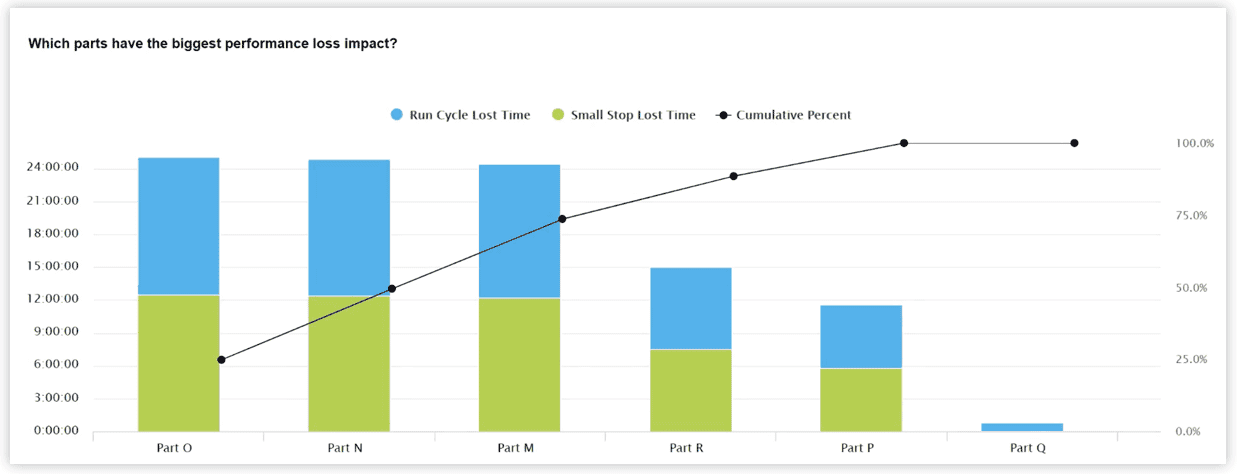
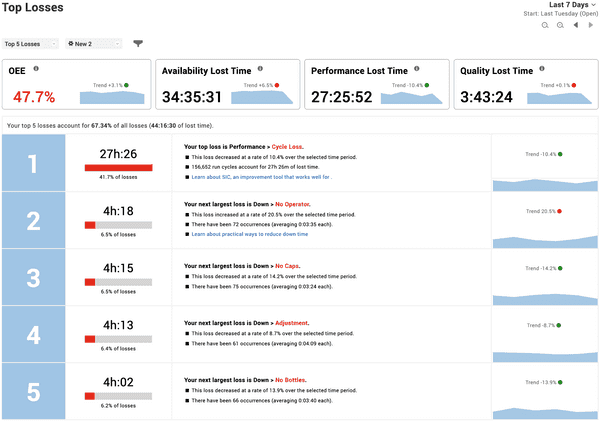
Solution: Use XL to view Top Losses for the most recent week or month (a long enough time period to provide representative information). If Speed Loss (a.k.a. cycle time loss) is one of the top five losses, consider taking action. The higher Speed Loss appears in Top Losses the more important it is to take action. It may also be important to take action if Speed Loss is trending up (shown by a red Trend indicator).

3. Attack Cycle Time Loss On the Factory Floor
Problem: We need some practical ways to reduce cycle times.
Strategy: Attack cycle time loss at the source – involve operators by exposing problems as they occur.
Solution: Use the XL Scoreboard and Short Interval Control (SIC) to communicate real-time information that exposes problems and encourages operators to take immediate action.
- Changeover: Display the Ideal Cycle Time and Last Cycle Time during changeovers to help the operator configure the equipment to the optimal operating speed.
- Running If the process is running slowly (e.g., a sequence of 100 cycles takes 10% longer than the Ideal Cycle Time) alert operators so corrective action can be taken (or so that a reason can be logged for later analysis).
- Short Interval Control As can be seen in the earlier Top Losses image, SIC is a recommended improvement tool for attacking cycle time loss. SIC uses quick and focused reviews of performance data during the shift to enable ongoing course corrections and small-scale fixes (collectively resulting in significant improvements in performance).

Start Reducing Cycles Times with a Free XL Trial
With the Vorne XL Productivity Appliance™ you can:
- Win the shift by giving operators real-time visibility into cycle time performance
- Identify and eliminate slow cycles and small stops as they happen
- Instantly access 100+ real-time metrics including OEE, Six Big Losses, and TEEP
- Provide supervisors and managers immediate insights with 50+ built-in reports
- Customize data views with an unlimited number of tailored reports
- Receive automated alerts and shift summaries to keep improvements on track
The Vorne XL Productivity Appliance™ is an industrial IoT (IIoT) device that brings all of this together in one simple package. Our most popular model is $3,990 and includes unlimited users, free software updates, free technical support, and an industry-leading 3-year warranty. There are 42,000+ XL installations across 45+ countries, and we encourage new applications to start with a free 90-day trial.
Book a one-on-one webinar, and one of our product experts will explore how XL can help your team reduce cycle time and improve performance.


