Manufacturing Productivity Use Cases
Improve With XL
The XL Productivity Appliance™ is an extremely flexible and powerful tool for improving manufacturing productivity. Our goal with XL is simple – make it incredibly easy for you to achieve unprecedented improvements in manufacturing productivity.
To give you a better sense of how XL can help, we have put together a collection of popular manufacturing improvement use cases that are enhanced by XL.
Use Cases
Create a Digital Twin
Simulate Your Process
The deeper your understanding of your process, the more effectively you can target your improvement efforts. What better way to understand your process than to create a digital model of it?
We have simplified this idea into an actionable first step toward simulating and improving your process.
Improve Productivity
The Core Imperative
It can be difficult to know where to start when embarking on a broad program to improve manufacturing productivity. There's a lot of well-written and insightful theory, but much less in the way of practical tips and insights.
So while you are evaluating large-scale initiatives like Lean Manufacturing, Theory of Constraints, and Six Sigma, we have hand-picked three of our favorite strategies for delivering quick wins.
Learn More About Improving Productivity

Increase Capacity
Unlock Your Hidden Factory
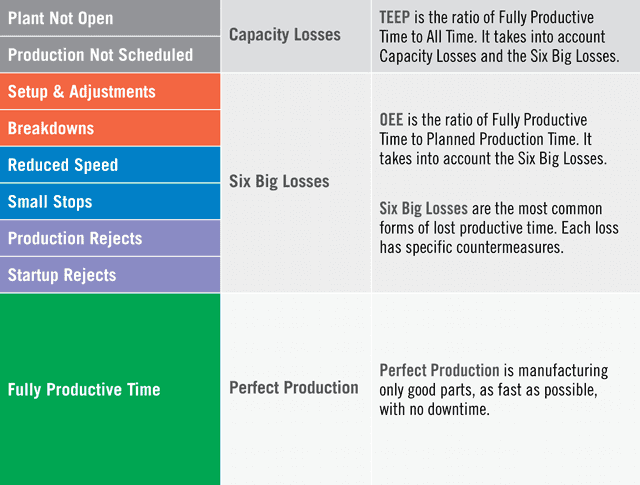
Have you ever heard of the “hidden factory”? It's a really useful concept, based on the fact that most equipment is not used anywhere near its true capacity. In fact, the difference between typical manufacturing (OEE score of 60%) and world-class manufacturing (OEE score of 85%) represents a 41.6% increase in capacity.
So before you purchase new equipment to increase capacity, make sure you know how much untapped potential there is in your factory.
Learn More About Increasing Capacity
Reduce Changeover Times
More Run, Less Inventory
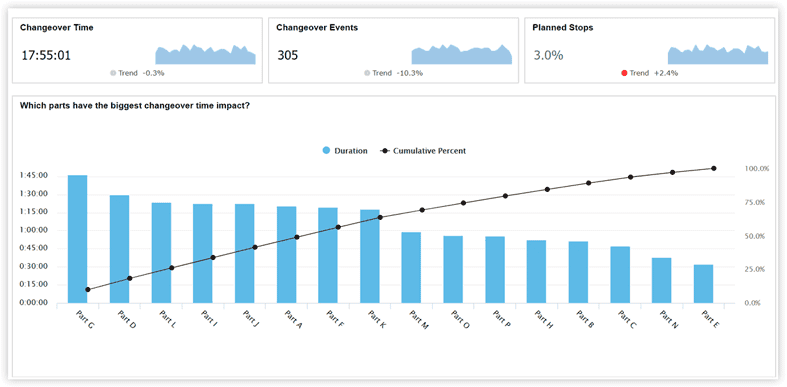
Changeovers are periods of time where equipment is unavailable due to tooling changes, material changes, or any other changes to production that must be performed while equipment is stopped. By applying best practices to changeovers, their duration can often be reduced to less than 10 minutes.
Shorter changeovers mean more time for running production, smaller batch sizes, and less inventory.
Learn More About Reducing Changeover Times
Reduce Cycle Times
Make Every Cycle Count
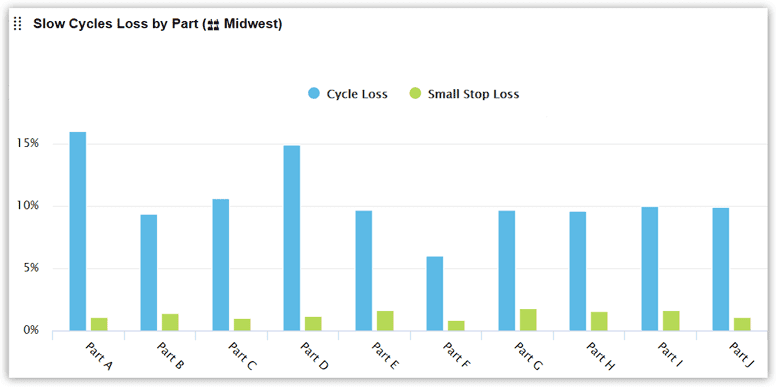
Cycle time loss occurs whenever equipment runs slower than its maximum theoretical speed (the Ideal Cycle Time). It's an aspect of production that benefits greatly from automated measurement as cycle losses are extremely difficult to capture manually. As a result, many manufacturers find that cycle time losses are hidden – they are not tracked and not acted upon.
Learn More About Reducing Cycle Times
Validate Your Cycle Time Standards
Reduce Down Time
Attack the Largest Source of Lost Time
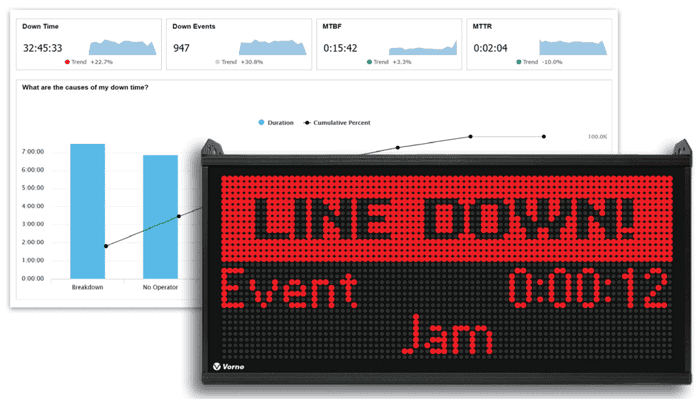
Down time typically gets a high level of focus in manufacturing. Equipment failures and breakdowns are highly visible, and for most manufacturers unplanned stops are the single largest source of lost production time.
Reducing down time is often the fastest and most direct path to improved manufacturing productivity. Unfortunately, many companies don't realize that their down time information is both inaccurate and insufficient. Fortunately, this is an easy problem to fix.
Learn More About Reducing Down Time
Reduce Manufacturing Costs
Spend Less, Make More
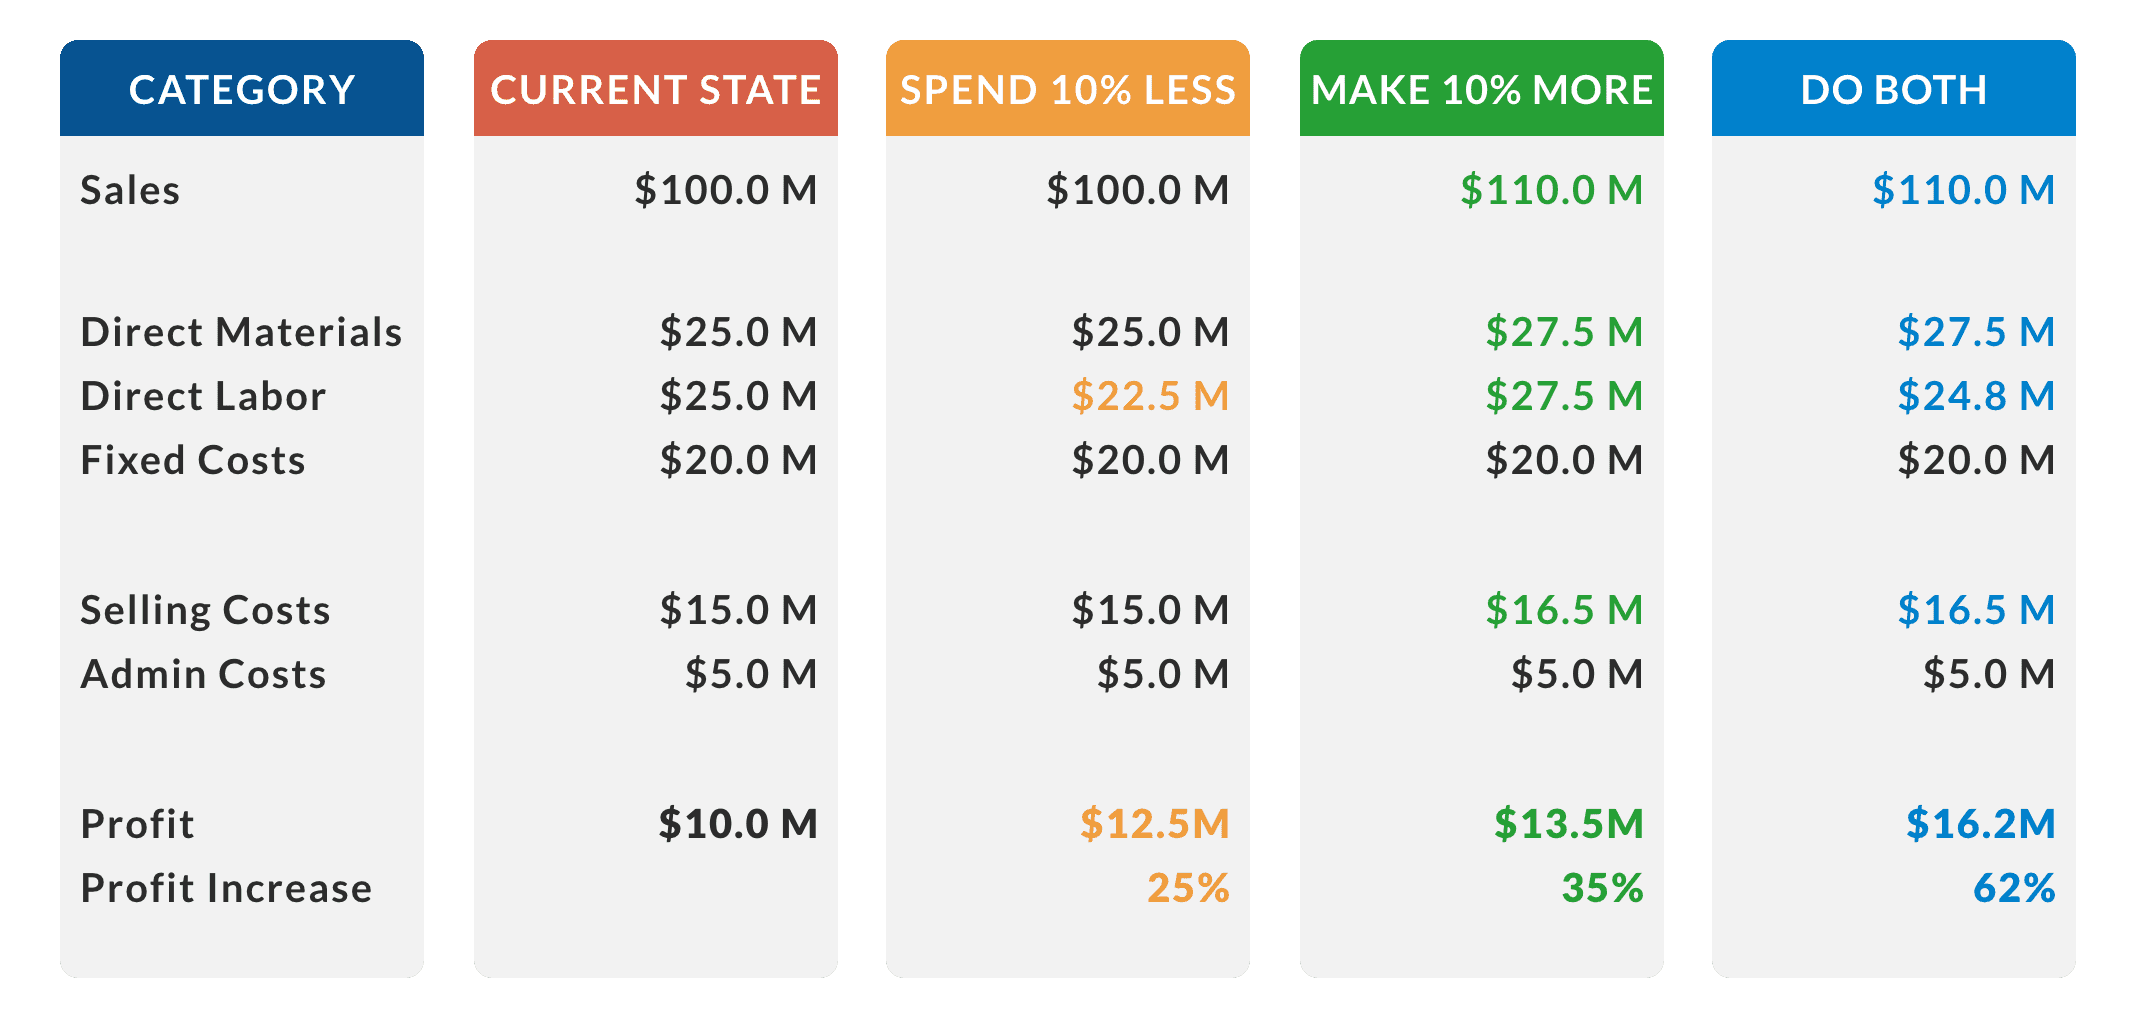
There are two particularly interesting perspectives on reducing manufacturing costs: spend less (manufacture the same number of parts in less time) OR make more (manufacture more parts in the same time).
Lean Manufacturing tends to focus on the former (by eliminating waste), while the Theory of Constraints tends to focus on the latter (by increasing throughput). Both offer proven techniques for reducing manufacturing costs.
Win the Shift
Plan, Adjust, Debrief
When your operators are equipped to hit a production target and “win the shift”, you’re guaranteed to win your week, month, and quarter.
